Turn Data into Your Competitive Edge
Turn Data into Your Competitive Edge
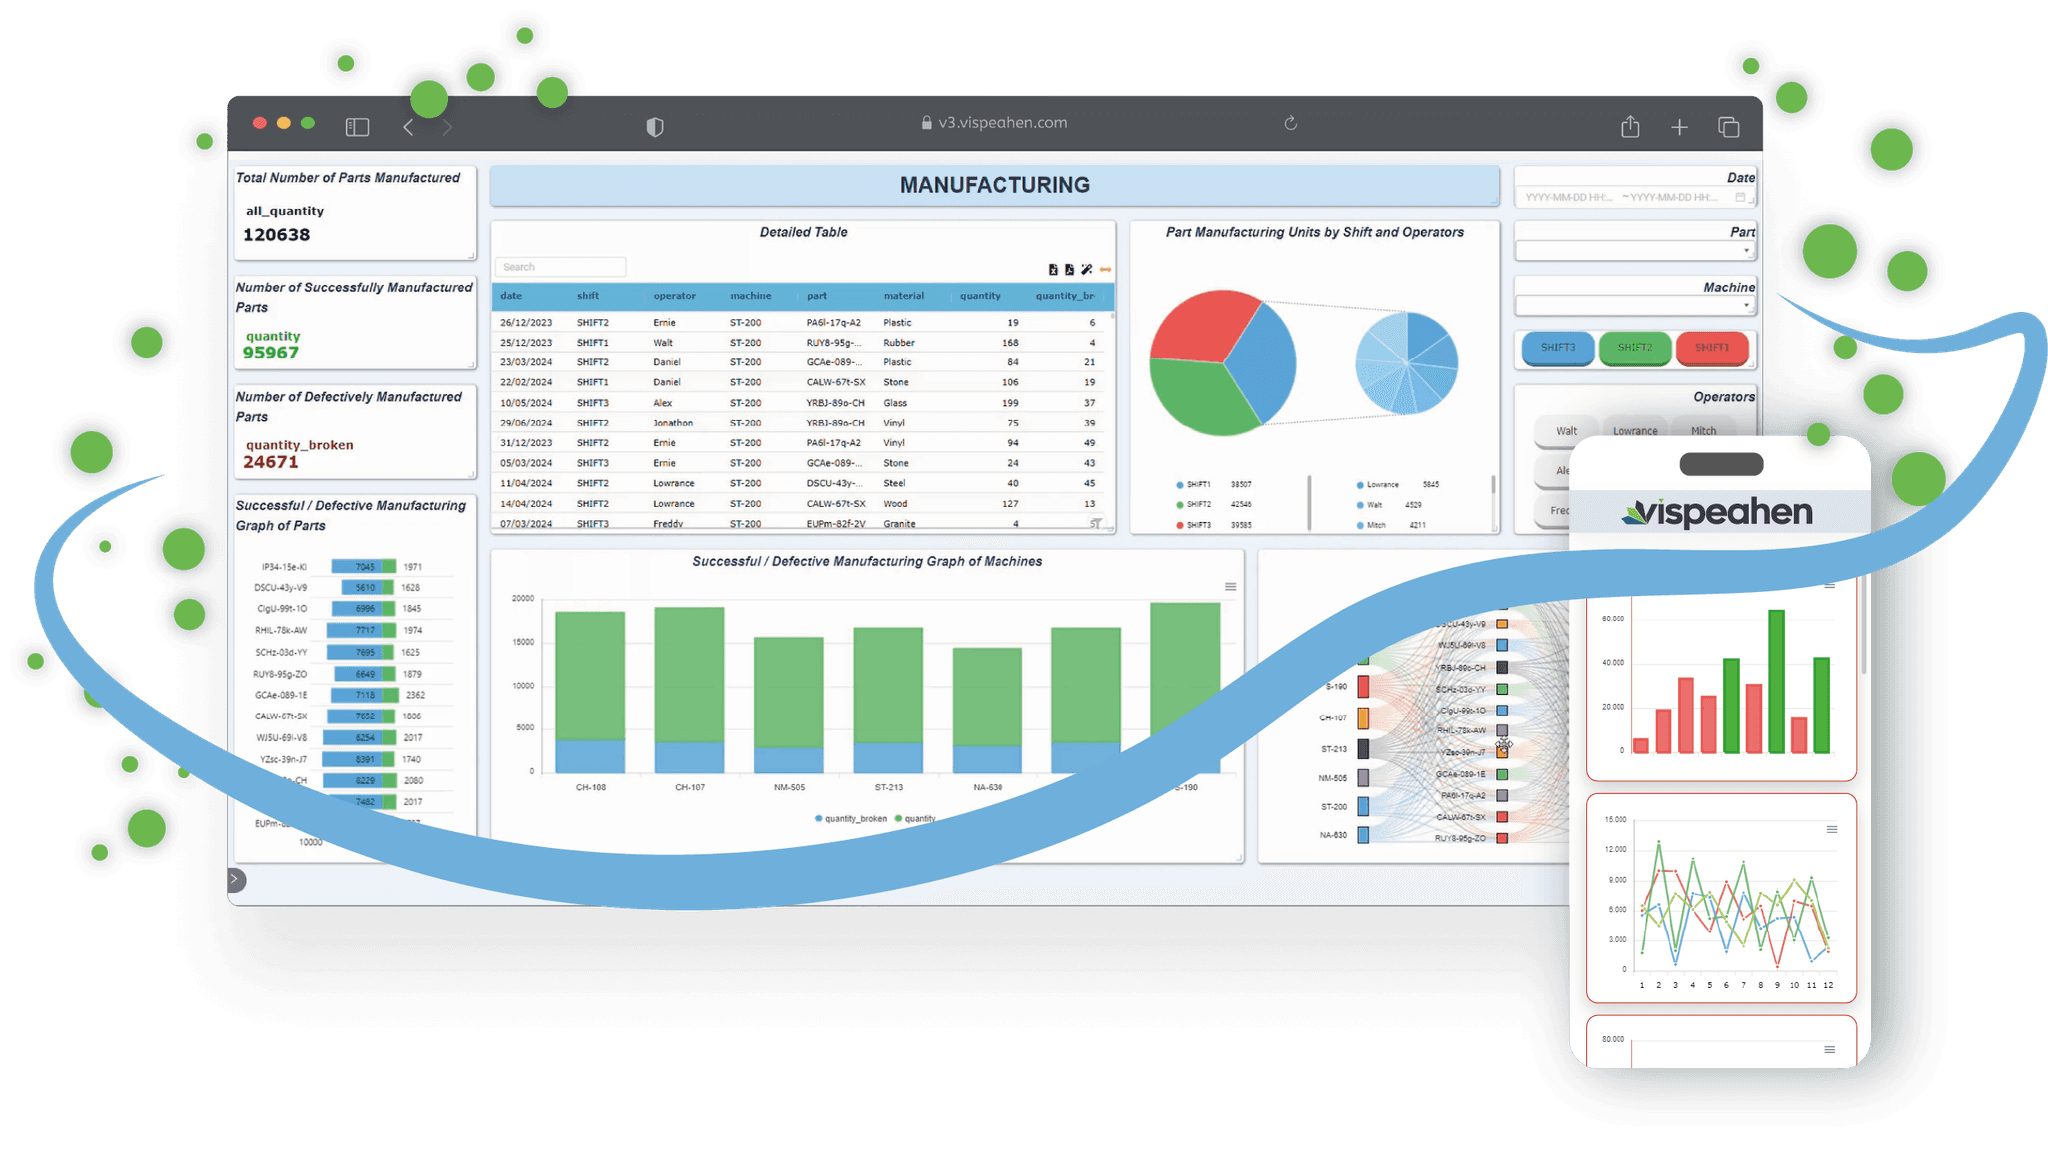
Vispeahen is a data analysis and visualization platform built on 15+ years of Business Intelligence expertise. It turns complex data into actionable visuals for faster, informed decisions, accessible on any device via your browser—no installation needed.
Vispeahen provides a powerful solution for the modern business world, driving your company toward a data-driven future. It simplifies complex data with striking visuals and detailed analyses, making it easy for everyone to understand and act on your data insights.
Vispeahen provides a powerful solution for the modern business world, driving your company toward a data-driven future. It simplifies complex data with striking visuals and detailed analyses, making it easy for everyone to understand and act on your data insights.

Turn Data into Your Competitive Edge
Vispeahen provides a powerful solution for the modern business world, driving your company toward a data-driven future. It simplifies complex data with striking visuals and detailed analyses, making it easy for everyone to understand and act on your data insights.
01
About Us
Vispeahen is an analysis and visualization platform that transforms your complex data into understandable and effective insights, making data-driven decision-making easier than ever.
With a mission to enrich complex datasets with visual tools that everyone can understand and a vision to offer a solution where businesses of all sizes can easily analyze their data and make strategic decisions, Vispeahen is by your side wherever data exists!
Discover the Power of Data-Driven Success with Vispeahen
Discover the Power of Data-Driven Success with Vispeahen
While Vispeahen makes it easy to visualize your data, it also provides you with all the tools you need to optimize your business processes by responding to real-time changes.
Now is the time to understand your industry’s data and generate value from it!
Contact us, and let's take your business to the next level!
Drilldown
It allows you to perform detailed analysis of the data.
Stream Data Analysis
It analyzes real-time data streams.
What If?
Scenario analysis is conducted to compare the outcomes of different assumptions.
Conditional Formatting
It formats data according to specific conditions to make it more meaningful.
Map Integration
It enables the visualization of data on geographic maps.
Navigation Feature
Allows users to easily transition from summary to details.
Personal Dashboard
It allows users to create their own dashboards.
Mobile Application
It provides access from mobile devices, allowing usage from anywhere.
Theme
It offers unlimited customizable theme creation for each dashboard and automatically applies the settings of the active theme.
Permission Management
Provides advanced authorization by managing user access and permissions.
Report Generation
Allows you to organize your data and create professional-looking printed reports.
Email Sending
Analyses can be shared instantly or scheduled via email.
Embedded Use
Allows you to use your analyses within your own application.
Connection to Different Data Sources
It connects to different data sources, integrating various data sets.
Advanced Cache
It provides advanced caching solutions for fast data access and high performance.
03
Seamless Data Connectivity with Vispeahen
Vispeahen offers seamless integration with all data sources, providing users with effortless access to critical data, whether it’s from cloud platforms, relational databases, flat files, or APIs. Unlock the full potential of your information by consolidating diverse data streams into a unified platform, ensuring real-time insights and efficient analytics for better decision-making.
Vispeahen integrates seamlessly with all data sources, giving users easy access to critical data from cloud platforms, databases, flat files, or APIs. Consolidate data streams into a unified platform for real-time insights and efficient analytics, driving better decisions.
04
Frequently Asked Questions
04
Frequently Asked Questions
What is Vispeahen? What kind of services does it offer?
Does Vispeahen offer cloud and on-premise deployment options?
Is technical knowledge required to use Vispeahen?
Does Vispeahen have a mobile app?
Is support service available?
05
Pricing and Packaging
04
Pricing and Packaging
Discover our adaptable pricing and packaging solutions designed to meet your specific needs. From scalable plans to tailored packages, we offer options that provide maximum value for your business. Click below to request detailed pricing information and find the perfect solution for you.
Discover our adaptable pricing and packaging solutions designed to meet your specific needs. From scalable plans to tailored packages, we offer options that provide maximum value for your business. Click below to request detailed pricing information and find the perfect solution for you.
06
05
Trusted by Various Companies from Different Industries...
Trusted by Various Companies from Different Industries...


07
Happy Clients!
06
Happy Clients!
Küçükpazarlı Aerospace
Küçükpazarlı Aerospace
Vispeahen helps us track and make decisions quickly across all processes based on data by creating robust and scalable solutions for a wide range of functions, from the supply chain to production, that we need within our company.
Vispeahen helps us track and make decisions quickly across all processes based on data by creating robust and scalable solutions for a wide range of functions, from the supply chain to production, that we need within our company.
Taha Küçükpazarlı
Taha Küçükpazarlı
TÜRİB
TÜRİB
In the era of digital transformation we are living in, being able to work with data quickly is a crucial function. Vispeahen is our data analysis and visualization platform that we use to make data-driven decisions, continue developing, and ultimately achieve success.
In the era of digital transformation we are living in, being able to work with data quickly is a crucial function. Vispeahen is our data analysis and visualization platform that we use to make data-driven decisions, continue developing, and ultimately achieve success.
Hüseyin Ciğeroğlu
Hüseyin Ciğeroğlu
VEDAŞ
VEDAŞ
We chose Vispeahen for our Edvars (Electricity Distribution Data Warehouse and Reporting) project. This allowed us to provide the desired reporting system in a flexible and fast manner. We are experiencing the advantage of reporting our data from different sources in the way we want.
We chose Vispeahen for our Edvars (Electricity Distribution Data Warehouse and Reporting) project. This allowed us to provide the desired reporting system in a flexible and fast manner. We are experiencing the advantage of reporting our data from different sources in the way we want.
06
Download Vispeahen on Your Mobile Phone!
Get It on Google Play
Download on The App Store
07